Dashboards are a feature in monday.com that provides a visual overview and highlights relevant data in one place. Dashboards consist of different shapes, called widgets, that summarize and connect data from one or more boards. There are over 30 widgets available to help you understand the progress of your projects, track your budget, estimate workload, and more. A dashboard can contain many different widgets, each designed to present data in your preferred way.
What are dashboards?
Dashboards help to give you a more holistic overview of your work tasks and ensure that you stay up-to-date on what is happening on several boards. You can create dashboards in monday.com in two different ways; you can create a “dashboards view” directly in a board or under workspaces. If you create a dashboard directly in a board, you can only pull data from the selected board. The other option is to create a dashboard under a given workspace, where you can connect data from several different boards in one widget.
Step 1.1 Creating dashboards directly in a workspace
To create a dashboard directly in a workspace, click on “+ Add” to the left of the workspace. Then click “New dashboard”.

Step 1.2 Creating dashboards directly in a board
To create a dashboard under a board, open one of your boards. Click the “+ Add View” icon above the workspace you want to add a dashboard. Then click on “Dashboards”, as shown in the image.

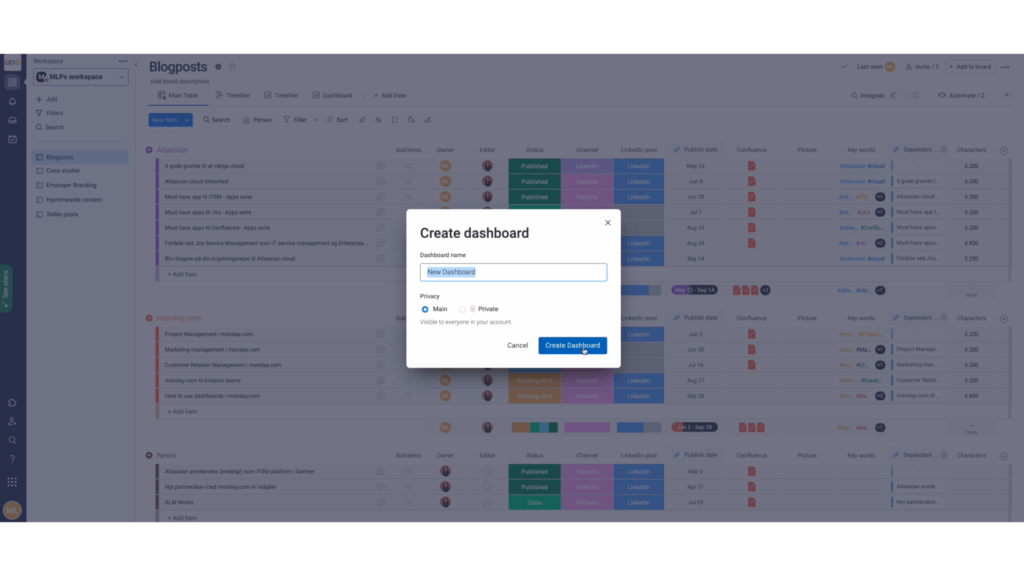
Trin 2. Main Dashboard or Private Dashboard?
You can choose between two types of dashboards: Main Dashboards and Private Dashboards:
- Everyone on your account will be able to see your Main Dashboard, which makes it easier to invite guest users to your board.
- A Private Dashboard will only be visible to you and the selected colleagues or guests you invite.
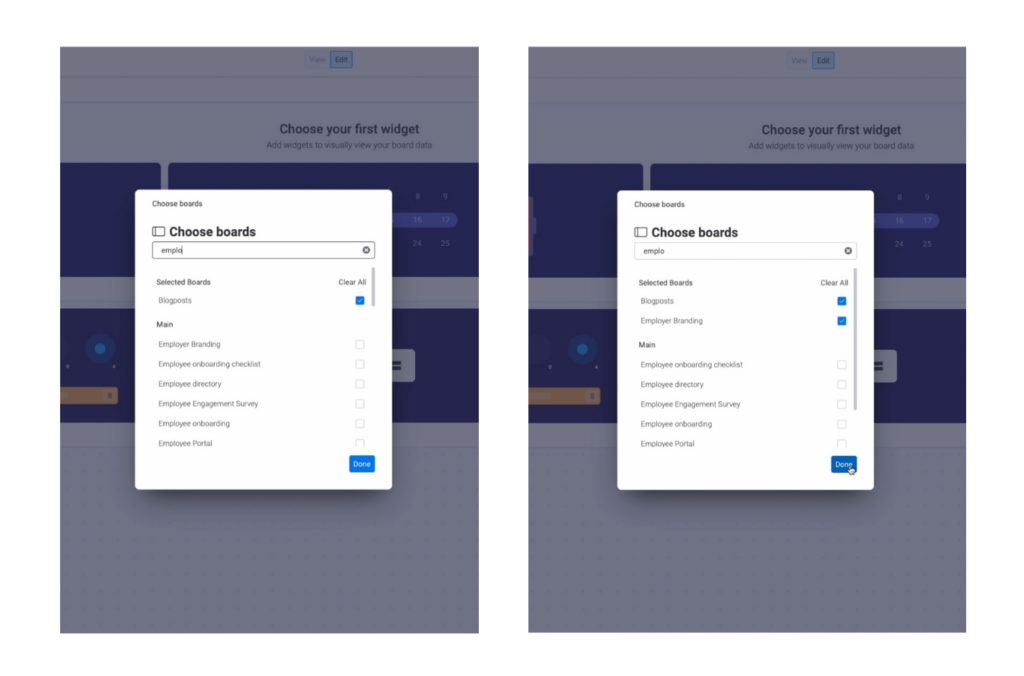
Step 3. Choose from your boards you want to connect to your dashboard
When you create a new dashboard, a list will appear in the creation process where you can select the boards you want to display in the dashboard. This list will show your most recently used boards when you start connecting your boards. If you are looking for a specific board, you can search for it in the search field. When you’re done, click “Done.”
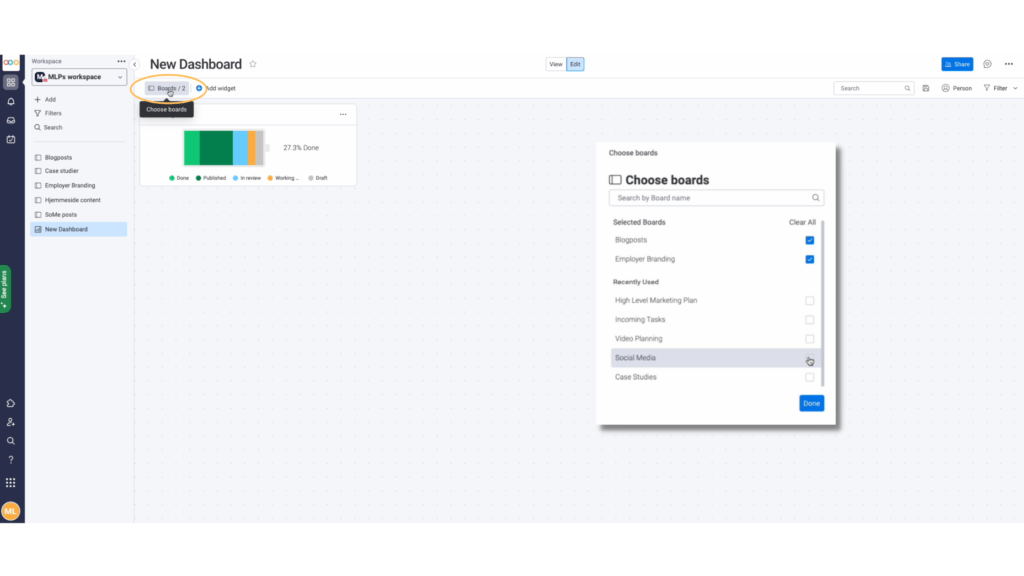
To add and remove boards, click “Boards” in the upper left corner of your dashboard to select the boards you’d like to connect or remove from your dashboard.
Step 4. Setting up widgets
Your dashboard can contain many types of widgets, each presenting different data from the selected boards. To add a new widget, click on the “Add Widget” icon and select the type of widget you want.

Step 4.1 Setting widgets
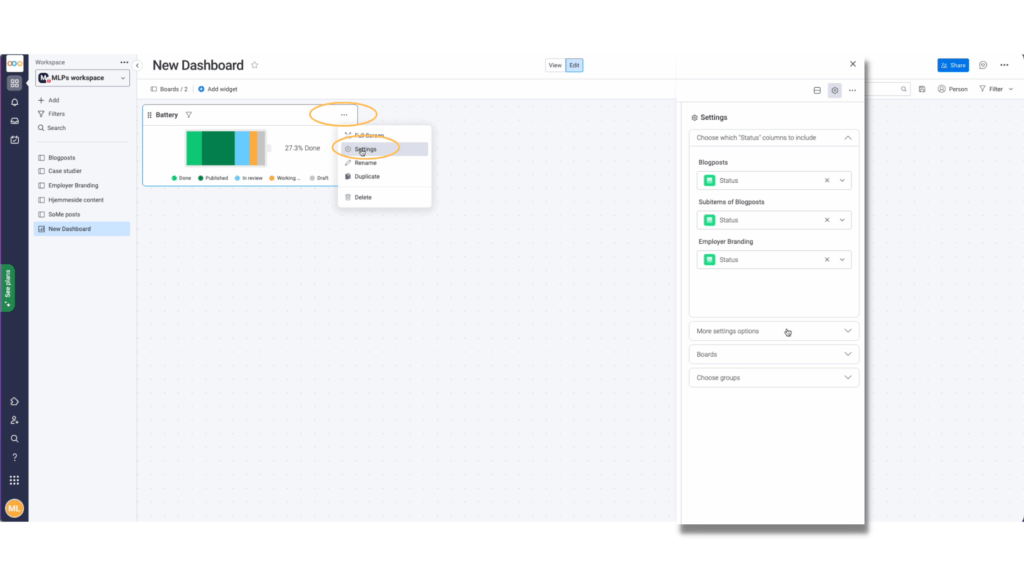
Click on the three dots “…” and then “settings”, as shown in the image, to change and customize your widget.
Popular widgets
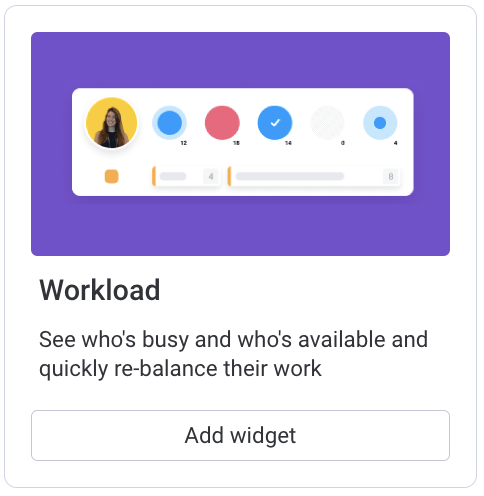
The Workload Widget shows how your team’s work is divided and the timeline of the future workload. With Workload, you can gain insight into work tasks from several projects, avoiding overloading and ensuring an improved workflow with your team.
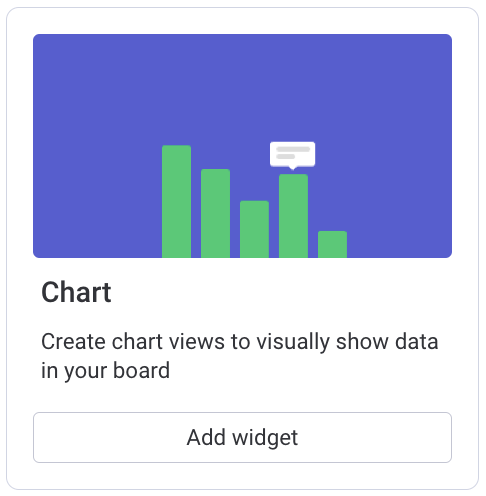
Chart Widget pulls information from multiple boards and combines them into one chart. Chart is a fantastic tool for analyzing and creating an overview of your and the team’s performance.
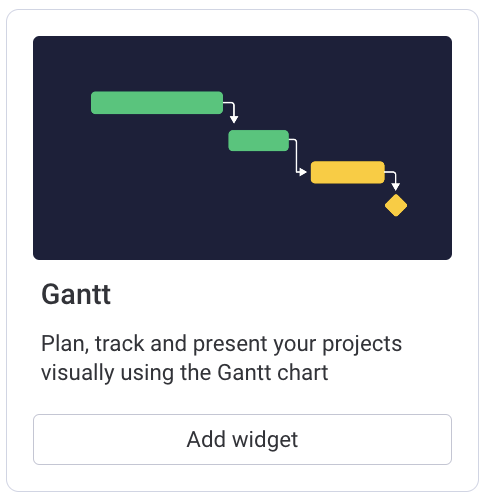
Gantt Widget is an indispensable tool when it comes to planning projects. Gantt gives you a combined visual presentation of your deadlines and future tasks in one view. The connected dependency lines take your project management to the next level.
If you want to know more about dashboards in monday.com, or need help setting up your dashboards, please feel free to contact our monday.com Account executive Helena Sadeghi on +45 31 22 33 00 or nhs@aety. in Island.


